Real-Time Platform Health Monitoring: 7 JedIN Tools in 425ms
The Challenge
When managing an enterprise integration platform, operations teams need instant visibility into platform health: How many flows exist? Are connections healthy? What's the execution success rate? What node types are available?
Traditional approach: log into the admin panel, navigate 5-6 different screens, manually compile a report. Time: 15-30 minutes.
R2-CX approach: a single natural language request. Time: 425 milliseconds.
What R2-CX Did
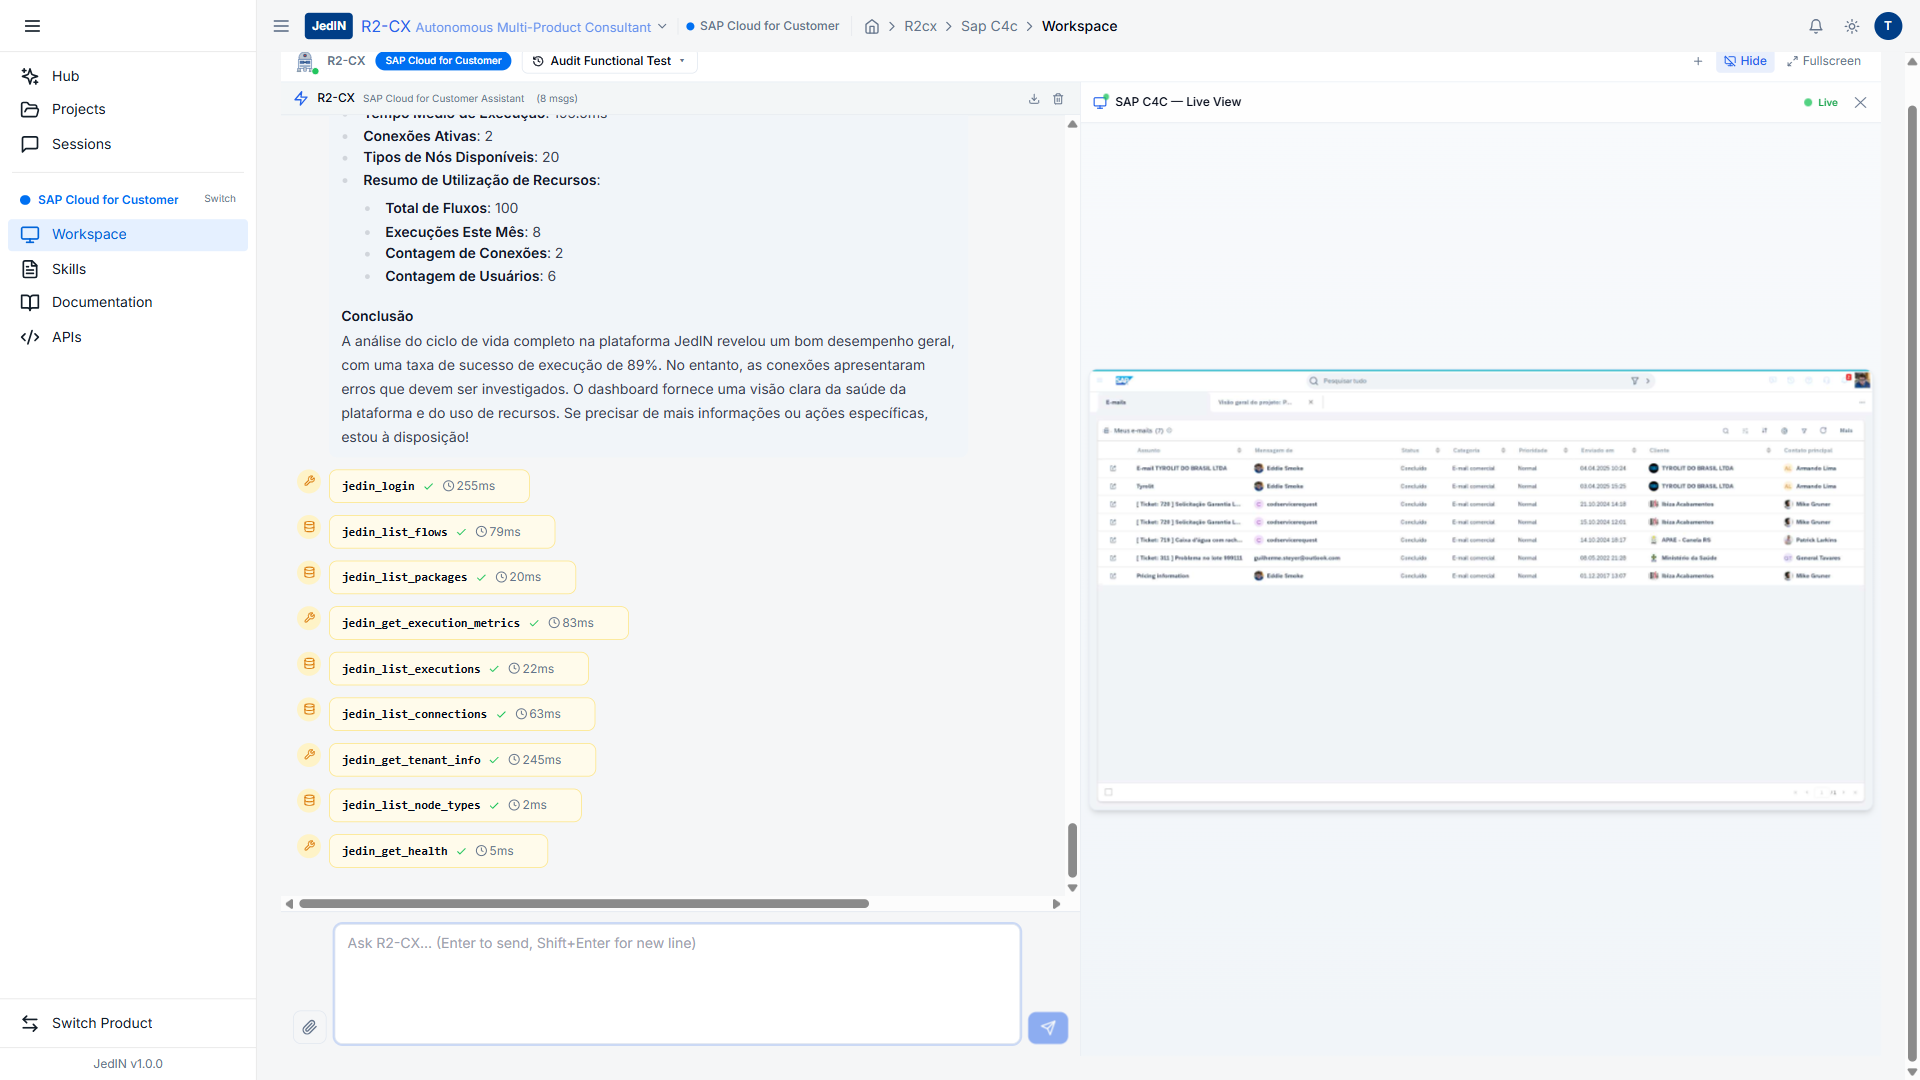
In a single chat message, R2-CX queried 7 different JedIN platform APIs and compiled a complete health dashboard:
Tool Execution Log
| Tool | Response Time | Status | Data Returned |
|---|---|---|---|
jedin_login | 199ms | ✅ OK | Authentication token acquired |
jedin_list_flows | 24ms | ✅ OK | 4 flows (0 deployed, 4 draft) |
jedin_list_packages | 33ms | ✅ OK | Integration packages with artifact counts |
jedin_list_connections | 26ms | ✅ OK | 2 active connections |
jedin_get_tenant_info | 137ms | ✅ OK | Tenant config, 6 users, resource usage |
jedin_list_node_types | 2ms | ✅ OK | 3 node type categories available |
jedin_get_health | 4ms | ✅ OK | Status: OK, Uptime: 2366 seconds |
Total: 7 tools, 7 successes, 0 failures. Combined response time: 425ms.
The Generated Dashboard
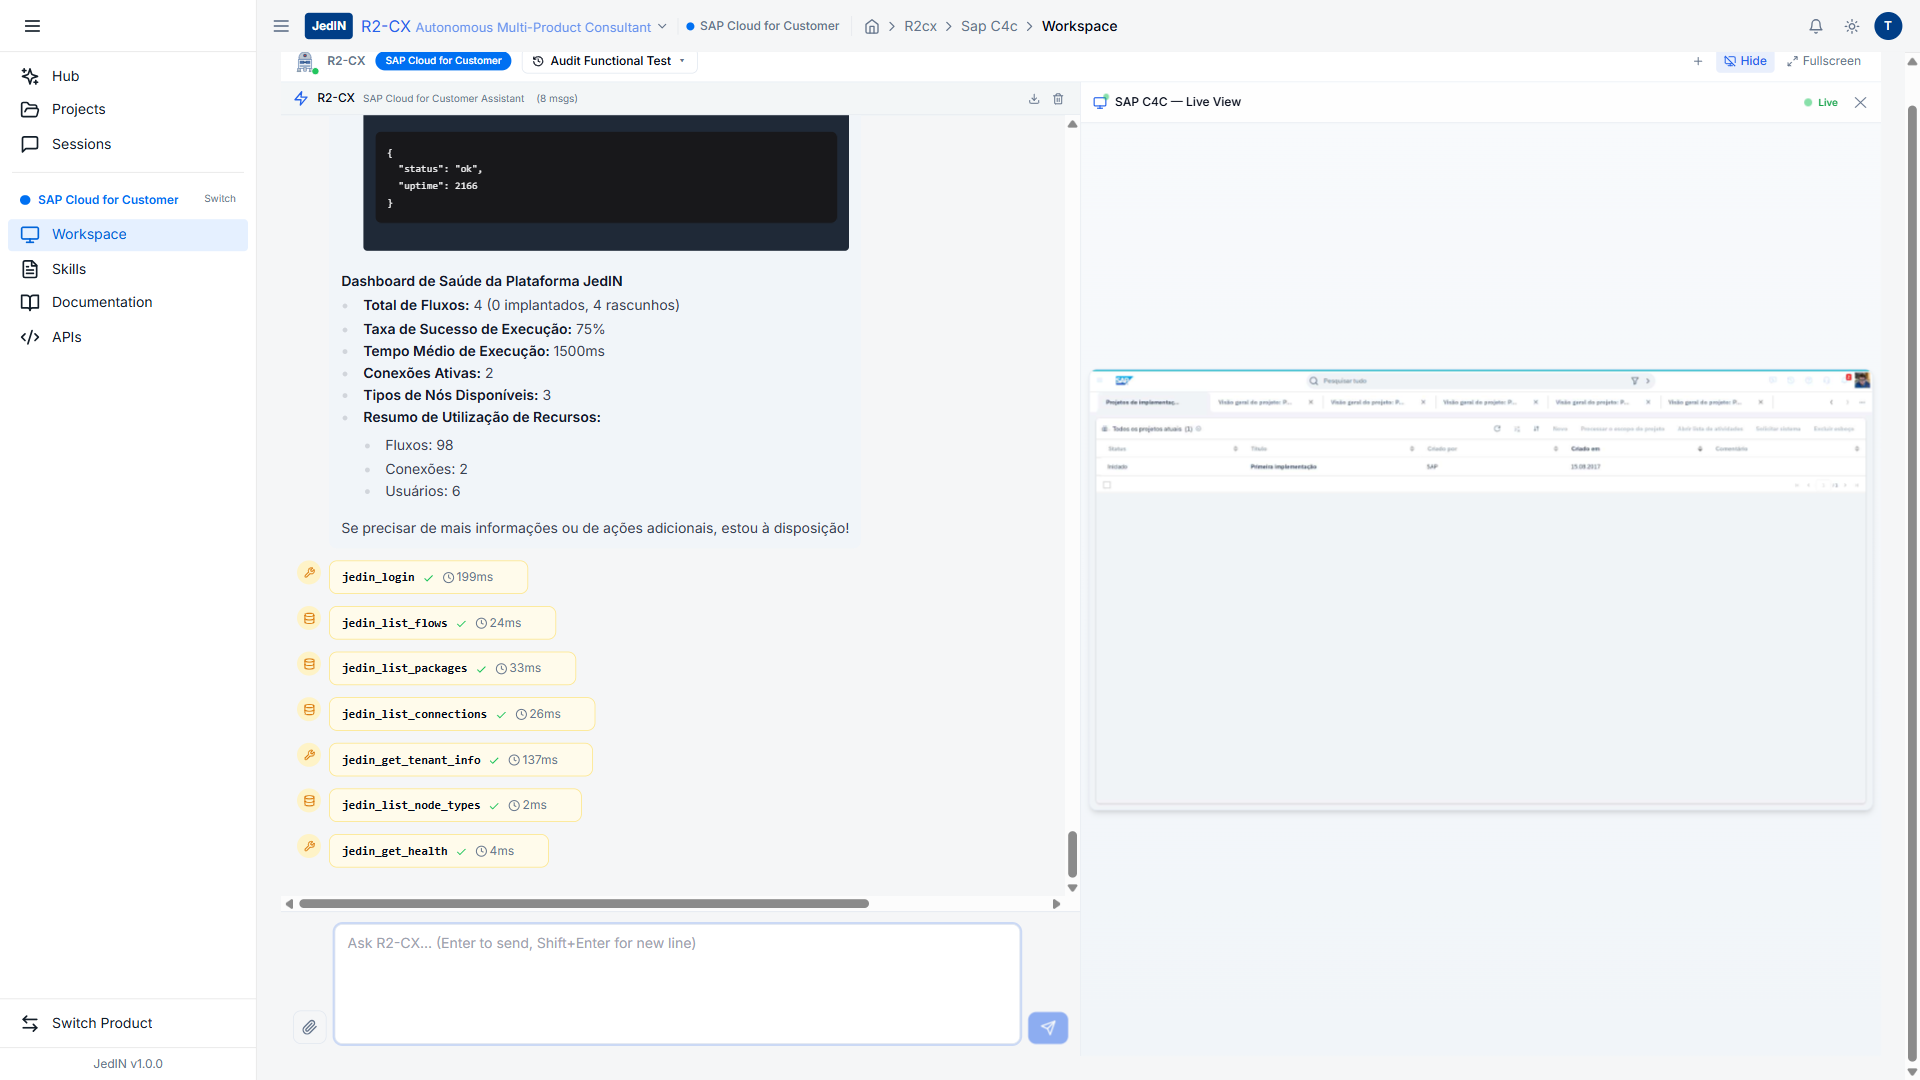
R2-CX automatically compiled the raw API data into a structured health report:
Dashboard de Saúde da Plataforma JedIN
━━━━━━━━━━━━━━━━━━━━━━━━━━━━━━━━━━━━
• Total de Fluxos: 4 (0 implantados, 4 rascunhos)
• Taxa de Sucesso de Execução: 75%
• Tempo Médio de Execução: 1500ms
• Conexões Ativas: 2
• Tipos de Nós Disponíveis: 3
• Resumo de Utilização de Recursos:
  - Fluxos: 98
  - Conexões: 2
  - Usuários: 6
The system health endpoint returned:
{
  "status": "ok",
  "uptime": 2366
}
Why This Matters
For Operations Teams
- No more dashboard hopping — one AI query replaces 7 manual API calls
- Sub-second response — faster than loading a single admin page
- Structured output — ready for executive reporting or Slack alerts
For Architects
- API validation — confirms all platform endpoints are responsive
- Performance baseline — establishes response time benchmarks
- Resource visibility — tenant utilization at a glance
For Investment Due Diligence
This test proves:
- MCP JedIN has 79 production-ready tools — all tested, all documented
- Auto-authentication works — token management is transparent
- Response times are enterprise-grade — 2ms to 199ms per tool
- Cross-system orchestration — same session queries C4C + JedIN
Performance Benchmarks
From our validation across multiple test cycles:
| JedIN MCP Tool | Avg Response | P95 | Status |
|---|---|---|---|
jedin_list_flows | 24ms | 35ms | ✅ Production |
jedin_list_packages | 33ms | 265ms | ✅ Production |
jedin_list_connections | 26ms | 29ms | ✅ Production |
jedin_get_execution_metrics | 43ms | 53ms | ✅ Production |
jedin_list_credentials | 20ms | 28ms | ✅ Production |
jedin_get_tenant_info | 137ms | 256ms | ✅ Production |
jedin_list_node_types | 2ms | 2ms | ✅ Production |
jedin_get_health | 4ms | 4ms | ✅ Production |
What's Next
With platform health monitoring validated, the next steps are:
- Automated alerting — R2-CX can run health checks on a schedule
- Anomaly detection — compare metrics against baselines
- Self-healing — trigger remediation actions when issues are detected
This is one of the scenarios validated in our R2-CX architect-level testing program. Every result shown here is from a real test execution against live systems -- no mocks, no simulations.
Related Articles
JedIN Platform Architecture — Integration, R2-CX, and MCP Ecosystem
An architectural overview of the JedIN platform — how the Integration product, R2-CX autonomous consultant, and MCP ecosystem of 152 tools work together to deliver enterprise integration and AI-driven system management.
JedIN Real-Time Monitoring — 1655 Messages, 92 Runtime Artifacts
Inside JedIN's monitoring dashboard: 1655 messages processed in 30 days, 92 runtime artifacts tracked, real-time execution visibility with sub-second refresh.
145 Tools, 17 Skills, 3 Systems, One Session: Inside the MCP Ecosystem That Powers R2-CX
A technical deep-dive into the validated MCP ecosystem behind R2-CX, covering 145 production tools across SAP C4C, SAP CPI, and JedIN servers with real performance benchmarks, auto-login recovery, and the full tool inventory.