JedIN Monitoring Guide: Reading the Real-Time Dashboard
Master Your Integration Operations in 8 Steps
Integration monitoring is the difference between reacting to failures and preventing them. When your business runs on automated data flows between SAP, e-commerce platforms, databases, and cloud services, every failed message represents a delayed order, a missing invoice, or a broken customer experience.
JedIN's Monitoring dashboard gives operations teams a single pane of glass across all running integrations. This guide walks you through every section of the dashboard, explains what each metric means, and tells you exactly when to take action.
<video controls width="100%" style={{borderRadius: '8px', marginBottom: '1.5rem'}}> <source src="/blog/videos/jedin-monitoring-tour.mp4" type="video/mp4" /> Your browser does not support the video tag. </video>
Prerequisites
Before starting, confirm you have:
- A JedIN account with access to the JedIN Integration product
- At least one deployed integration flow — the monitoring dashboard shows data only for flows that have executed at least once
- Operator or Admin role — read access to monitoring data requires the Operator role or higher
- A modern browser — Chrome, Edge, or Firefox (the dashboard uses real-time WebSocket updates for live data)
Step 1: Navigate to the Monitoring Page
- Log in to JedIN and ensure you are in the JedIN Integration product (check the product selector in the top-left corner of the header).
- In the left sidebar, locate the Monitor menu item under the main navigation.
- Click Monitor to open the monitoring dashboard.
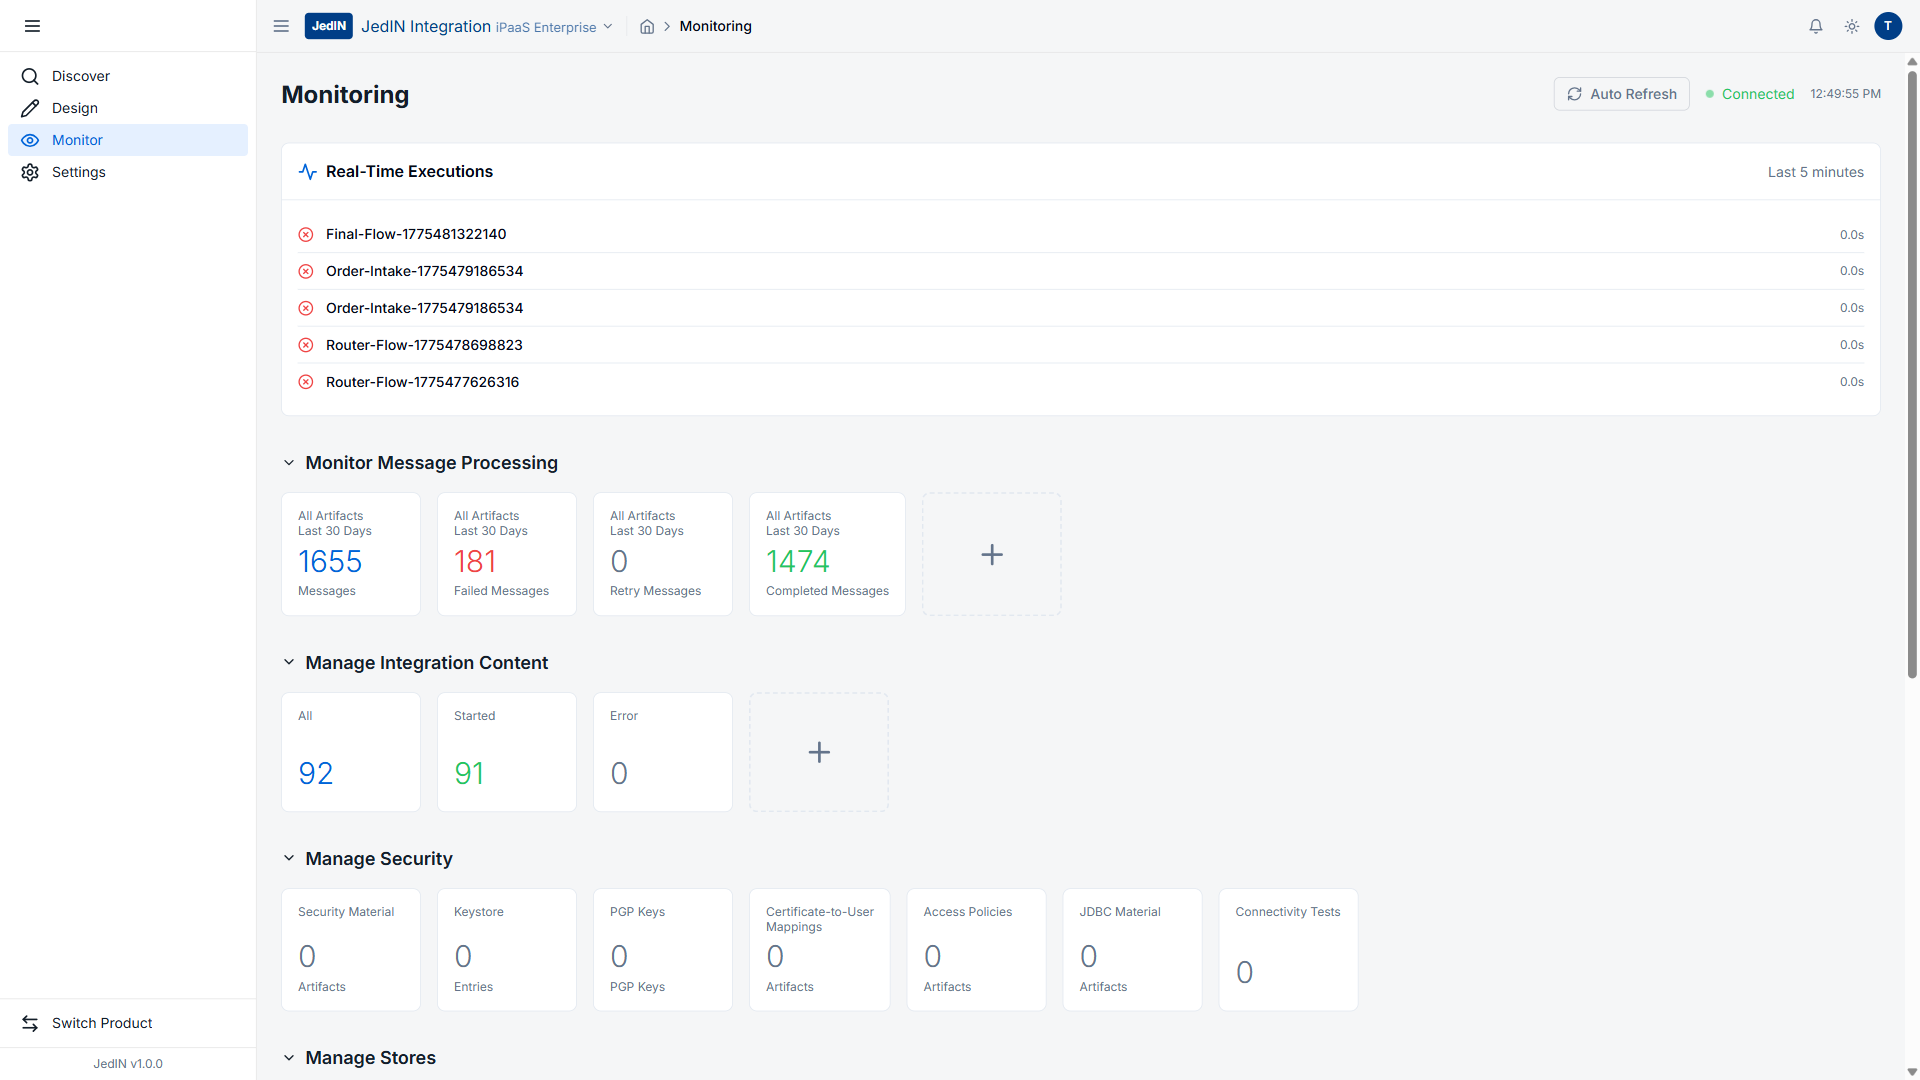
Expected Result: The browser navigates to /monitoring. The page loads with four main sections: Real-Time Executions, Monitor Message Processing, Manage Integration Content, and Manage Security. A green "Connected" status indicator appears in the header area.
Step 2: Read the Real-Time Executions Section
The top section of the dashboard displays Real-Time Executions (Last 5 minutes) — a live feed of every integration flow that executed in the most recent 5-minute window.
- Look at the table at the top of the page. Each row contains two columns: Flow Name and Execution Time.
- Identify the status indicator next to each flow name:
- A green circle indicates the execution completed successfully.
- A red circle indicates the execution encountered an error.
- Note the execution time for each flow. Times are displayed in seconds (e.g., "0.0s" means sub-100ms execution).
Expected Result: You see a list of recently executed flows with their completion times. In a healthy environment, most entries show green circles with sub-second execution times.
When to take action: If you see red circles appearing consistently for the same flow, that flow has a recurring error. Click the flow name to investigate the execution details and error logs. If execution times exceed 5 seconds, the flow may be experiencing resource contention or external service latency.
Step 3: Analyze Message Processing Metrics
Below the real-time section, you find Monitor Message Processing — aggregate statistics for all messages processed across your integrations.
- Locate the four metric tiles displayed in a horizontal row.
- Read each tile from left to right:
- Messages — The total number of messages processed in the selected time range.
- Failed Messages — Messages that encountered errors and could not be delivered.
- Retry Messages — Messages currently queued for automatic retry.
- Completed Messages — Messages that were processed and delivered successfully.
- Check the time range indicator. The default view shows Last 30 Days.
Real Data Example: In a production JedIN environment, the dashboard shows:
| Metric | Value |
|---|---|
| Messages | 1,655 |
| Failed Messages | 181 |
| Retry Messages | 0 |
| Completed Messages | 1,474 |
Expected Result: The four tiles populate with your environment's actual numbers. The sum of Failed + Retry + Completed should equal the total Messages count.
When to take action: Calculate your failure rate: Failed / Messages * 100. In the example above, the failure rate is 181 / 1655 = 10.9%. A failure rate above 5% warrants investigation. A failure rate above 15% is critical — check your connection credentials, external service availability, and flow configurations immediately. If Retry Messages is non-zero, messages are actively being retried and you should monitor whether they eventually succeed or move to Failed.
Step 4: Review Integration Content Status
The Manage Integration Content section shows the deployment status of all your integration artifacts (flows, adapters, and scripts).
- Locate the three tiles below the message processing section:
- All — Total number of deployed integration artifacts.
- Started — Artifacts that are currently running and active.
- Error — Artifacts that failed to start or crashed during execution.
- Compare the Started count against the All count.
Real Data Example:
| Metric | Value |
|---|---|
| All | 92 |
| Started | 91 |
| Error | 0 |
Expected Result: In a healthy environment, Started should equal or be very close to All, and Error should be 0. The example shows 91 out of 92 artifacts running successfully — the one artifact not in "Started" state may be intentionally stopped or in a deploying state.
When to take action: If the Error count is greater than 0, one or more integration artifacts have failed. Click the Error tile to filter and see which artifacts are affected. Common causes include expired credentials, schema changes in external systems, or memory limits exceeded. If Started is significantly lower than All, multiple artifacts may have been stopped — verify whether this was intentional (e.g., a maintenance window) or indicates a systemic issue.
Step 5: Explore Security Material
The Manage Security section provides quick access to all security-related configurations for your integrations.
- Review the available security categories:
- Security Material — OAuth tokens, API keys, and other authentication credentials used by your integration flows.
- Keystore — SSL/TLS certificates and private keys for secure communication.
- PGP Keys — Encryption keys for PGP-encrypted file transfers.
- Certificate-to-User Mappings — Maps client certificates to JedIN user identities for mutual TLS authentication.
- Access Policies — Role-based access control rules for integration endpoints.
- JDBC Material — Database connection strings, credentials, and driver configurations.
- Connectivity Tests — Tools for verifying network connectivity to external systems.
- Click any category to drill down into its details.
Expected Result: Each category displays the count of configured items. Security Material and Keystore are the most commonly used sections for day-to-day operations.
When to take action: Review Security Material before credentials expire. Set calendar reminders for certificate renewal dates visible in the Keystore section. Run Connectivity Tests after any network changes or firewall rule updates to verify all integrations can still reach their external endpoints.
Step 6: Verify the Connection Status
- Look at the top-right area of the monitoring dashboard for the status indicator.
- Confirm you see a green dot next to the text "Connected".
- Note the timestamp displayed alongside the status — this shows when the connection was last verified.
Expected Result: A green dot with "Connected" and a recent timestamp (within the last few seconds) confirms that the monitoring dashboard has an active real-time connection to the JedIN runtime.
When to take action: If the status shows a red or yellow indicator, or if the timestamp is stale (more than 30 seconds old), the monitoring connection has been lost. This does not mean your integrations stopped running — it means the dashboard cannot display live data. Refresh the page. If the issue persists, check your network connection and the JedIN runtime service health.
Step 7: Enable Auto Refresh
- Locate the Auto Refresh button near the top of the monitoring dashboard.
- Click it to enable automatic data refresh.
- When enabled, the dashboard periodically polls for new data without requiring manual page refreshes.
Expected Result: The Real-Time Executions section updates automatically as new flows execute. Message processing counters increment in near-real-time. You can leave the dashboard open on a secondary monitor for continuous visibility.
When to take action: Disable Auto Refresh if you are analyzing a specific point-in-time snapshot and do not want the data to change while you investigate.
Step 8: Interpret the Full Picture
With all sections reviewed, combine the metrics to assess your integration health:
- Healthy state: All executions green, failure rate below 5%, all artifacts Started, 0 Errors, Connected status green.
- Warning state: Occasional red executions, failure rate between 5-15%, all artifacts Started, 0 Errors. Investigate the failing flows but no immediate emergency.
- Critical state: Multiple red executions, failure rate above 15%, Error count greater than 0, or disconnected status. Immediate investigation required.
Expected Result: You can now classify your environment's health at a glance and know exactly which section to drill into when something needs attention.
Troubleshooting
The dashboard shows no data
- Cause: No integration flows have been deployed or executed in the selected time range.
- Solution: Deploy at least one integration flow and trigger an execution. Return to the monitoring dashboard after the flow completes.
Real-Time Executions is empty but Message Processing shows data
- Cause: The Real-Time section only shows the last 5 minutes. If no flows executed in that window, the section is empty even though historical data exists.
- Solution: Wait for the next scheduled flow execution, or manually trigger a flow to see it appear.
Connection status shows "Disconnected"
- Cause: WebSocket connection to the runtime was interrupted.
- Solution: Refresh the browser page. If the issue persists, verify that the JedIN API service is running and accessible. Check for network proxy or firewall rules that may block WebSocket connections.
Failed Messages count is increasing rapidly
- Cause: An external service may be down, credentials may have expired, or a flow configuration change introduced errors.
- Solution: Check the most recent failed executions in the Real-Time section. Look for patterns — if all failures are from the same flow, investigate that specific flow's connections and configuration. If failures span multiple flows, check shared resources like database connections or authentication services.
All artifacts show as Started but messages are still failing
- Cause: The artifacts are running but encountering runtime errors during message processing (e.g., transformation errors, timeout on external calls).
- Solution: This is a logic-level issue, not a deployment issue. Review the error details in each failed execution to identify the specific step that fails.
Summary
The JedIN Monitoring dashboard provides four layers of visibility: real-time execution tracking, aggregate message metrics, artifact deployment status, and security material management. By following these 8 steps, you can assess your integration environment's health in under 60 seconds and know exactly where to investigate when issues arise. Make it a habit to check the dashboard at the start of each workday and after any deployment change.
Related Articles
JedIN Flow Designer Quick Start: Opening and Navigating Your First Flow
A step-by-step guide to opening your first integration flow in the JedIN Flow Designer — from login to exploring the canvas, node palette, properties panel, and toolbar controls.
JedIN Marketplace Guide: Browsing and Installing Connectors
A step-by-step guide to navigating the JedIN Marketplace — discovering connectors, browsing templates, and installing packages for your integration projects.
JedIN Real-Time Monitoring — 1655 Messages, 92 Runtime Artifacts
Inside JedIN's monitoring dashboard: 1655 messages processed in 30 days, 92 runtime artifacts tracked, real-time execution visibility with sub-second refresh.